Empower Your Finances with Vision Money: Seamlessly Manage, Budget, and Track Goals!
Vision Money Personal Finance App
Free without Ads:
Money Management, Budgeting, Reporting, and Goal Tracking
Vision Money Overview
Your Ultimate Financial Companion: A Comprehensive App for Goal Setting, Family Budgeting, Asset Tracking, and Money Management.
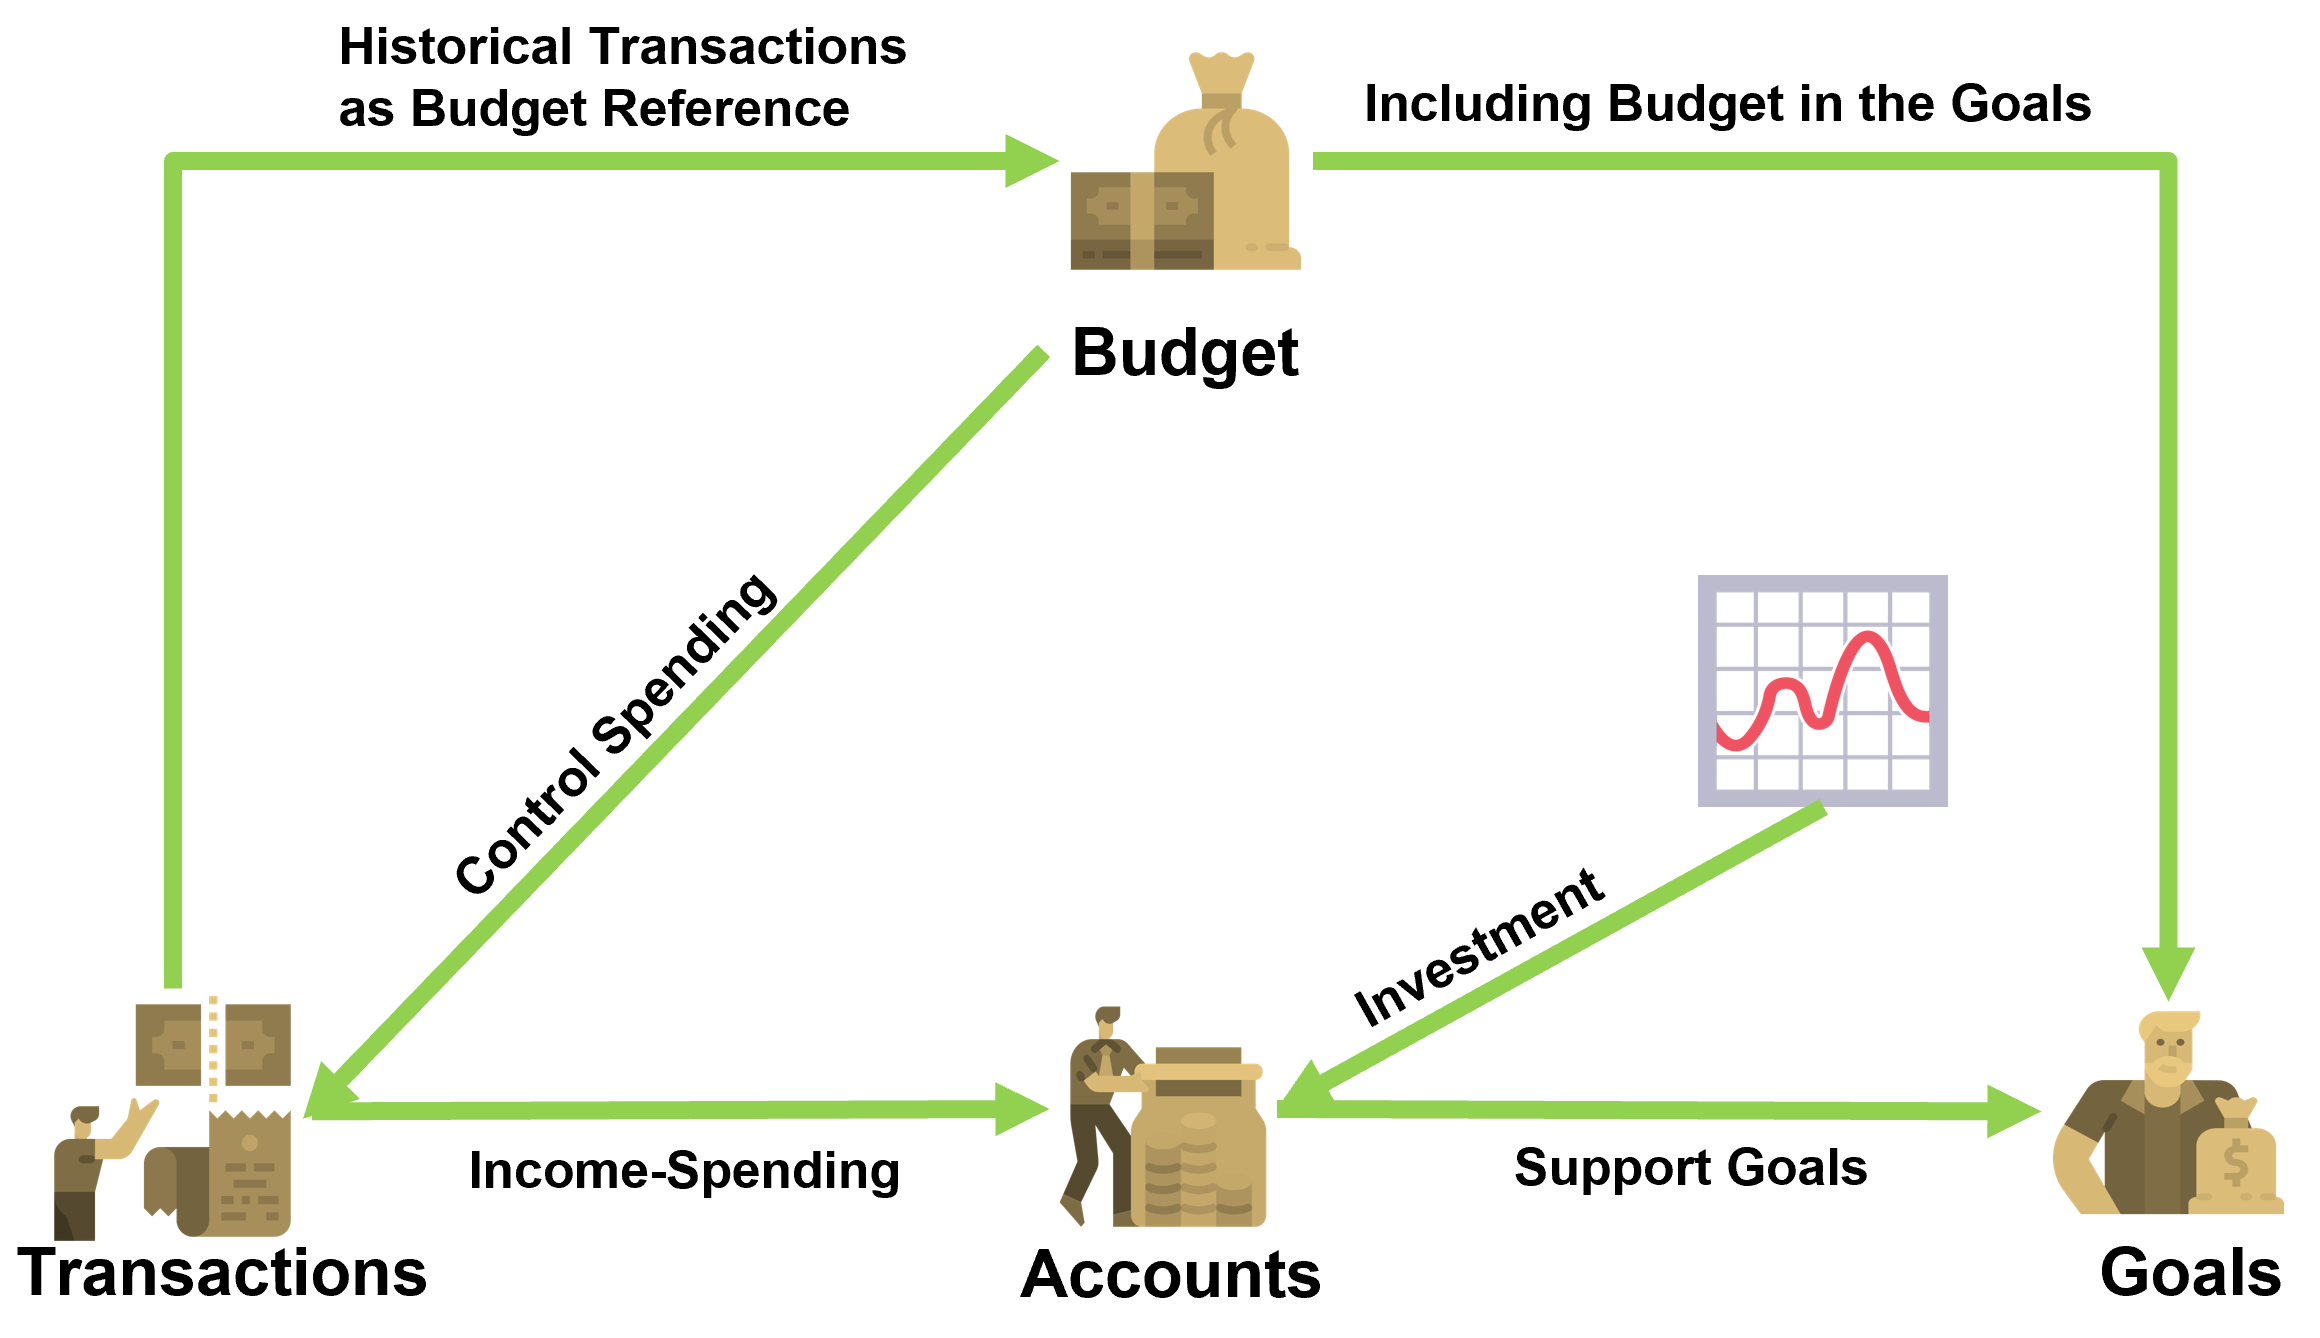
Integrate the Four Pillars of Personal Finance
Goals: set, assess feasibility, and track progress toward future dreams.
Budgets, monthly, compare planned income and spending to actual figures, serving as a daily financial tool.
Transactions provide valuable information, helping you understand your money flow and spending patterns.
Accounts track spending for financial goals, allowing monitoring of investment changes in net worth from past to present.
Vision Money Features: Financial Goals and Budget
Goal Setting and Assessment
Set various goals
Integrate and prioritize all goals
Calculate scenarios with varying target returns
Feasibility assessment of goals.
Goals Tracking
Early assessment of achieving goals
Analyzing reasons for unattainability
Examples include low income, overspending, or returns falling below target.
Responsibility & Coverage
Calculating responsibilities based on goals.
Inputting policy coverage.
Reviewing current coverage goals.
Calculating need coverage
My Budget
Manual and auto budget setup.
Monthly budget based on last month's balance or reset.
Dashboard alerts for overspending or shortfall.
Vision Money Features: Transactions and Accounts
Automated Transactions
Automated dividends and payouts updates.
Regular income and spending notifications.
Multi-currency financial recording.
Diverse Transactions.
Including spending, income, transfers, securities trade, balance adjustments, and transaction split.
Net Worth Tracking
Daily market price updates
Cross-account market value
Historical asset change tracking
Multi-currency asset value summary
Investment Performance
Time-weighted return.
Comparison with indices.
Analysis of investment gains and losses.
Assessment of investment risks.
Advantages of Vision Money
Tracking multiple goals
As a working woman in a dual-income household, managing the household expenses, mortgage, children's tuition, and thinking about the future when the kids grow up can be overwhelming. Planning for a secure retirement adds to the complexity.
With Vision Money, I can set multiple financial goals, prioritize them, and monitor them at any time. It integrates cash flow calculations for goals, simulates different return rates, tracks progress, and tackles individual financial challenges.
I'm a white-collar worker observing the boss's mood daily. Without my morning Starbucks, afternoon bubble tea, and evening outings, life loses its charm. However, by the end of the month, my wallet turns empty.
With Vision Money, I can manually or automatically set budgets, receive alerts for overspending, and get instant dashboard notifications. It calculates the remaining budget based on monthly limits, acting like a personal financial assistant.
Calculate need coverage
As the sole provider supporting my family's livelihood, my wife and children depend on me for everything. Besides daily expenses and education costs for the kids, my biggest concern is what would happen if I were to fall ill or suddenly be unable to provide for them.
With Vision Money, I can automatically calculate insurance coverage and family responsibilities based on financial goals. I can input existing life insurance policies to assess if the current coverage can meet our goals.
Time-saving automatic transactions
I'm a professional who wants to manage finances effectively, dealing with monthly salary deductions for insurance, rent payments, and tracking stock dividends.
With Vision Money, stock dividend notifications, scheduled income and spending notifications are in place. It supports various transaction entries like income, spending, transfers, salary deductions for insurance, advance payments, and even stock transactions including buying, selling, dividends – all consolidated in one record. Reimbursable advance payments for expense reporting are conveniently displayed, making accounting efficient and effortless.
Tracking of cross-account assets
I'm an investor keen on monitoring my investments, with accounts for retirement, investments, and savings, involving stocks, funds, and cash in various currencies. However, each account has its own data scattered across different apps. To assess my overall net worth and investment status, I end up manually organizing data into Excel, lacking real-time updates on market values.
With Vision Money, I can instantly track assets across accounts and download daily prices. Using one app, I can easily know the latest value of each account, making investment management efficient and stress-free!
Mastering investment performance
I'm an active stock trader, often jumping in and out based on which stocks are performing well or following the trend of ETFs. However, despite my efforts in investing, it's challenging to gauge the actual return on investment.
With Vision Money, I can set my investment goals, calculate time-weighted returns, and always stay informed about investment performance. I can assess if my goals are achieved by comparing them to historical performance and see how my results stack up against others.
Vision Money is a financial app available on iOS and Android. It starts with setting financial goals, making budgeting simple and easy, integrating investment information across accounts, tracking asset changes, and evaluating the status of financial goal achievement.
The Vision Money app and the Vision website (https://www.vision.money) are software services developed and operated by Vision Software, hereinafter referred to as Vision.
Disclaimer
The accuracy, availability, completeness, or utility of the information on Vision is not explicitly or implicitly guaranteed. Developers and partners of Vision are not liable for any losses, damages, or injuries resulting directly or indirectly from the use of Vision.
All content in Vision is public information or shared research experiences, and references to securities are for illustrative purposes only, not representing any financial product recommendations or suggestions, and do not predict future investments.